Monitoring process creation and termination events is a useful skill to have in you toolbox. This article consists of two parts. The first introduces exiting tools for diffrent platforms. The second explains how these tools work internally.
Introducing tools
Linux
forkstat
Forkstat monitors process fork(), exec() and exit() activity. It is mature and it’s available in most distribution’s repositories. Uses the Linux netlink connector to gather process activity.
# Ubuntu\Debian
sudo apt install forkstat
sudo forkstat -e exec
Time     Event   PID Info   Duration Process
21:20:15 exec   3378                 sleep 10

sudo forkstat -e exec,exit
Time     Event   PID Info   Duration Process
21:21:30 exec   3384                 sleep 10
21:21:40 exit 3384 0 10.003s sleep 10execsnoop (eBPF)
execsnoop traces process execution. It works by dynamic tracing an execve kernel function.
See the bcc installation instructions for your OS. On Ubuntu, versions of bcc are available in the standard Ubuntu repository as of Ubuntu Bionic (18.04). The tools are installed in /sbin (/usr/sbin in Ubuntu 18.04) with a -bpfcc extension.
sudo apt-get install bpfcc-tools linux-headers-$(uname -r)

sudo execsnoop-bpfcc
PCOMM            PID    PPID   RET ARGS
sleep 5380 5379 0 /usr/bin/sleep 10execsnoop
Precedessor of eBPF based execsnoop. Still relevant because it has no dependecies other that awk and works on older Linux kernel versions (3.2+).
wget https://raw.githubusercontent.com/brendangregg/perf-tools/master/execsnoop \
    -O /usr/local/bin/execsnoop  && chmod +x /usr/local/bin/execsnoop

execsnoopWindows
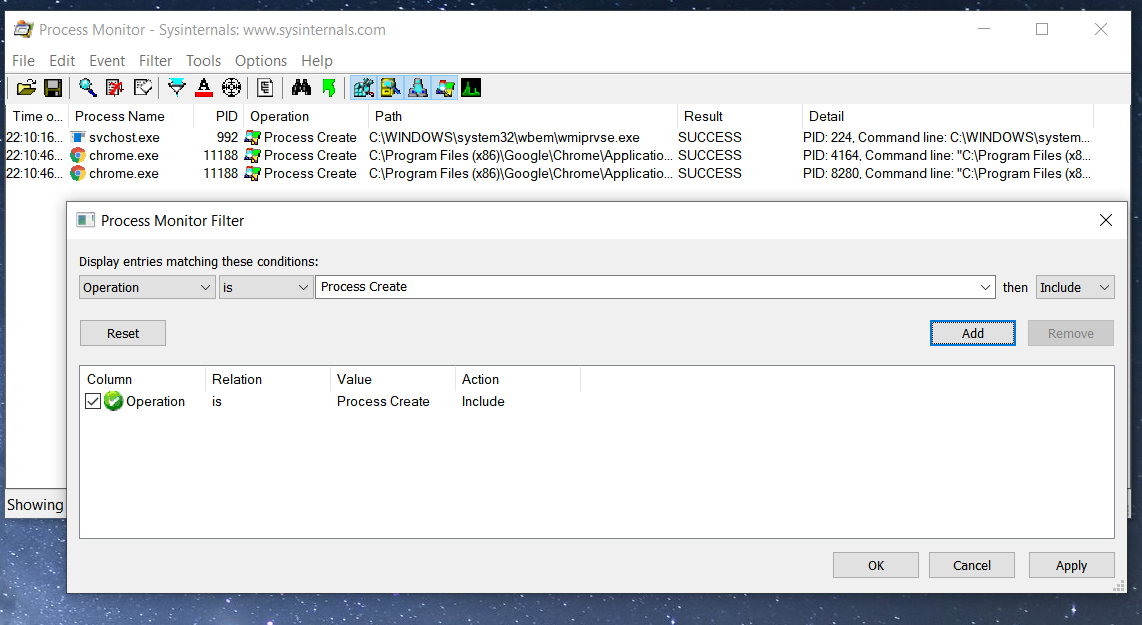
Process Monitor
Process Monitor, part of Sysinternals Suite is an advanced monitoring tool for Windows that can be used to keep track of process creation events. Can be downloaded as standalone executable from project’s website or installed with chocolatey package manager: choco install procmon. Also part of Sysinternals Suite package. Primarily created by Mark Russinovich and Bryce Cogswell
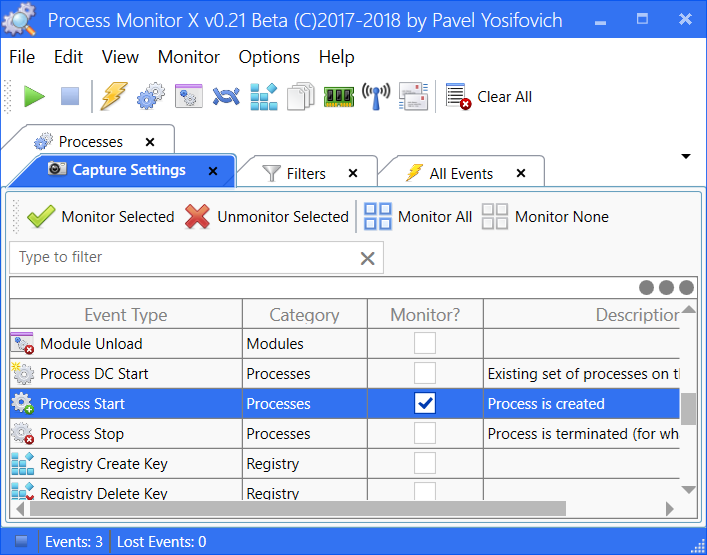
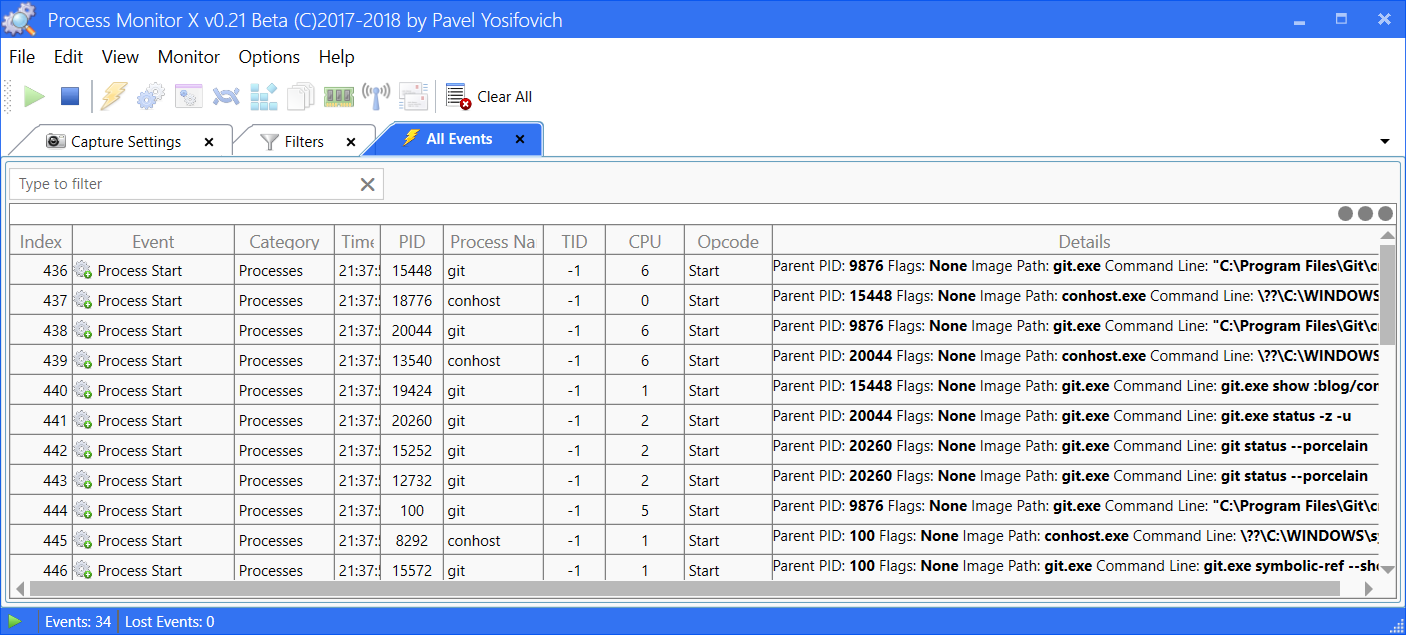
ProcMonX
Process Monitor X (ProcMonX) is a alternative to ProcMon created by Pavel Yosifovich . ProcMonX provides information on similar activities to ProcMon, but adds more events, such as networking, ALPC and memory. Can be downloaded as standalone executable from here.
PowerShell
Microsoft Scripting Guy, Ed Wilson shown that PowerShell can be used to monitor process creation.
Register-CimIndicationEvent `
    -ClassName Win32_ProcessStartTrace `
    -SourceIdentifier "ProcessStarted"

Get-Event | `
    Select timegenerated, `
        @{L='Executable'; E = {$_.sourceeventargs.newevent.processname}}

TimeGenerated       Executable
-------------       ----------
12.06.2019 22:28:19 ps.exe
12.06.2019 22:29:13 bash.exe
12.06.2019 22:29:13 bash.exe
12.06.2019 22:29:13 bash.exe
12.06.2019 22:29:13 git.exe
12.06.2019 22:30:47 chrome.exe
12.06.2019 22:30:48 chrome.exe

# Cleanup
get-event | Remove-Event
Get-EventSubscriber | Unregister-Event
See this article for details.
macOS
dtrace
sudo newproc.d will trace all new process with command line args. It won’t work if System Integrity Protection is on.
sudo newproc.d
dtrace: system integrity protection is on, some features will not be available

dtrace: failed to compile script /usr/bin/newproc.d: line 22: probe description proc:::exec-success does not match any probes. System Integrity Protection is on
El Capitan introduced a security mechanism called System Integrity Protection to help ensure that no malicious parties can modify the operating system and it severely limits what DTrace can do.
SIP has to be partially diabled
csrutil enable --without dtrace # disable dtrace restrictions onlyHow do these tools work
Forkstat
Forkstat uses the kernel Netlink connector interface to gather process activity. It allows program to receive notifications of process events such as fork, exec, exit, core dump as well as changes to a process’s name, UID, GID or SID over a socket connection.
With default parameters, forkstat will report fork, exec and exit events, but the -e option allows to specify one or more of the fork, exec, exit, core, comm, clone, ptrce, uid, sid or all events. When a fork event happens, forkstat will report the PID and process name of the parent and child, allowing one to easily identify where processes are originating. Forkstat attempts to track the life time of a process and will log the duration of a processes when it exits where possible. Note that forkstat may miss events if the system is under heavy load. Netlink connector also requires root privilege (or using CAP_NET_ADMIN capability).
Netlink is a Linux kernel IPC mechanism, enabling communication between a userspace process and the kernel, or multiple userspace processes. Netlink sockets are the primitive which enables this communication.
CONFIG_PROC_EVENTS kernel option enables Process Events Connector which exposes the process events to userland via a Netlink socket and was introduced in 2005 in this patch by Matt Helsley.
Forkstat’s source code is here but it’s very C-like in a sense that it manages to obfuscate relatively simple idea.
To let userspace know about different process events we will have to
- make a netlink socket and bind it
- send the
PROC_CN_MCAST_LISTENmessage to the kernel to let it know we want to receive events - receive events by reading datagrams from socket
- parse event data and extract the relevant process information
sock, _ := unix.Socket(unix.AF_NETLINK,
    // used interchangeably with SOCK_RAW
    unix.SOCK_DGRAM, unix.NETLINK_CONNECTOR)
addr := &unix.SockaddrNetlink{
        Family: unix.AF_NETLINK, Groups: C.CN_IDX_PROC, Pid: uint32(os.Getpid())}
unix.Bind(sock, addr)
send(sock, C.PROC_CN_MCAST_LISTEN)
for {
    p := make([]byte, 4096)
    nbytes, from, _ := unix.Recvfrom(sock, p, 0)
    nlmessages, _ := syscall.ParseNetlinkMessage(p[:nbytes])
    for _, m := range nlmessages {
			if m.Header.Type == unix.NLMSG_DONE {
                // netlink uses the host byte order
				cnhdr := (*C.struct_cn_msg)(unsafe.Pointer(&m.Data[0]))
				ptr := uintptr(unsafe.Pointer(cnhdr))
				ptr += unsafe.Sizeof(*cnhdr)
				pe := (*C.struct_proc_event)(unsafe.Pointer(ptr))
				switch pe.what {
				case C.PROC_EVENT_EXEC:
					e := (*C.struct_exec_proc_event)(unsafe.Pointer(&pe.event_data))
					fmt.Printf("Process started: PID %d\n", e.process_pid)
				case C.PROC_EVENT_EXIT:
					e := (*C.struct_exit_proc_event)(unsafe.Pointer(&pe.event_data))
					fmt.Printf("Process exited: PID %d\n", e.process_pid)
				}
			}
            }
    }

}exec_proc_event contains little data. We could try to immediately read process information from /proc/<PID> but that wouldn’t be reliable (it’s racy). There is a risk that by that time we read process information the process has already finished or even another one took its PID. Full example is here.
execsnoop (eBPF)
execsnoop is part of BCC. It’s a suite tools that use eBPF tracing: infrastructure to dynamically instrument the kernel. It allows to define programs that run in kernel. Learn about eBPF here or read execsnoop source code. The only downside is that these tools require new-ish kernel.
execsnoop
Hack from Brendan Gregg’s perf-tools collection. It traces stub_execve() or do_execve(), and walks the %si register as an array of strings. Check details on the author’s blog here.
Process Monitor
Process Monitor (ProcMon) installs a kernel driver on startup which does the system-wide monitoring of userland processes. Driver API provides the kernel routine PsSetCreateProcessNotifyRoutine/PsSetCreateProcessNotifyRoutineEx to allow software to monitor process creation and termination events in the Windows kernel. No code here, but this example from Windows Driver Kit (WDK) 10 is close to what we want.
ProcMonX
ProcMonX uses Event Tracing for Windows (ETW) (a diagnostics and logging mechanism that existed since Windows 2000) through Microsoft.Diagnostics.Tracing.TraceEvent library.
PowerShell
PowerShell example uses WMI (Windows Management Instrumentation) and Win32_ProcessStartTrace event.
Creating your own monitoring tool requires few lines of code
/*
 * csc procmon_wmi.cs
 */
using System;
using System.Management;

class ProcessMonitor
{
    static public void Main(String[] args)
    {
        var processStartEvent =
            new ManagementEventWatcher("SELECT * FROM Win32_ProcessStartTrace");
        var processStopEvent =
            new ManagementEventWatcher("SELECT * FROM Win32_ProcessStopTrace");

        processStartEvent.EventArrived +=
            new EventArrivedEventHandler(
                delegate (object sender, EventArrivedEventArgs e)
        {
            var processName = e.NewEvent.Properties["ProcessName"].Value;
            var processId = e.NewEvent.Properties["ProcessID"].Value;

            Console.WriteLine("{0} Process started. Name: {1} | PID: {2}",
                DateTime.Now, processName, processId);
        });

        processStopEvent.EventArrived +=
            new EventArrivedEventHandler(
                delegate (object sender, EventArrivedEventArgs e)
        {
            var processName = e.NewEvent.Properties["ProcessName"].Value;
            var processId = e.NewEvent.Properties["ProcessID"].Value;

            Console.WriteLine("{0} Process stopped. Name: {1} | PID: {2}",
                DateTime.Now, processName, processId);
        });

        processStartEvent.Start();
        processStopEvent.Start();

        Console.ReadKey();
    }
}
macOS
dtrace
DTrace is as dynamic tracing framework for Solaris, macOS and FreeBSD. You can learn more about DTrace Tools and read newproc.d source code here.